
analytics
Cart Abandonment Metrics Explained: What Every Number Means
Abandonment rate, prevention rate, added revenue, and more. Here's what each metric on the NavonaAI dashboard means and how it's calculated.
 ChatGPT
 Perplexity
 Gemini
 Claude
A dashboard full of percentages is only useful if you know what each number measures. Prevention Rate and Interventions Accepted might sound similar, but they measure different steps in the customer journey.
This guide explains the main metrics on the NavonaAI dashboard and how each one is calculated, so you can understand what your numbers actually mean.
The cart-to-order funnel
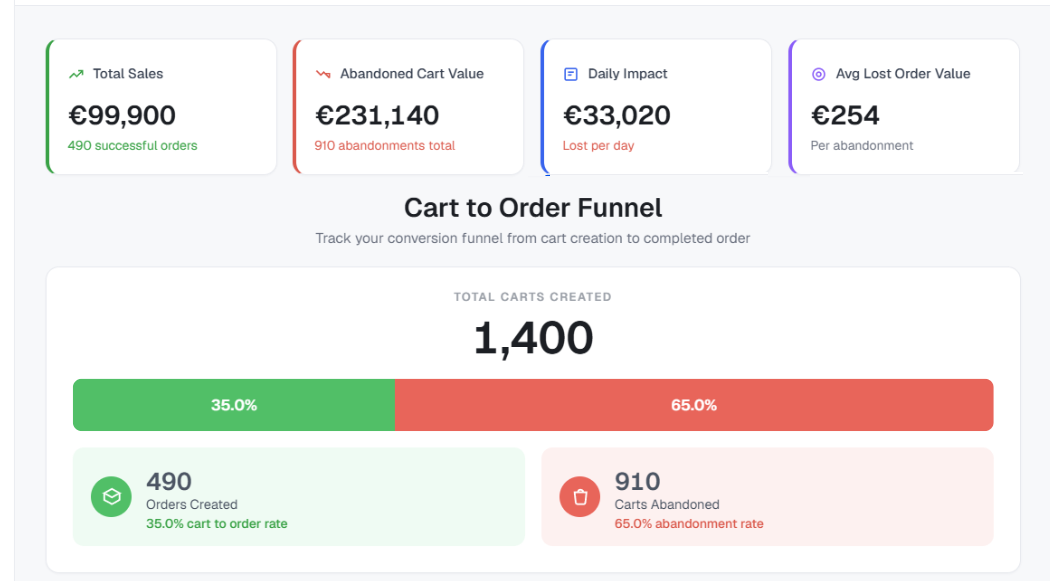
Every cart your store creates either becomes an order or is abandoned. This is the starting point for the cart metrics on your dashboard.
| Metric | What it means |
|---|---|
| Carts Created | The total number of carts created during the selected period. |
| Orders Created | The number of carts that became completed orders during the selected period. |
| Abandonment Rate | (Carts created − web orders) ÷ carts created. This only counts your Online Store channel. |
| Abandoned Cart Value | The total value of carts created during the period that never became an order. Bot traffic and abnormally large carts are excluded. |
To learn why automated traffic is excluded from Abandoned Cart Value, read how much of your cart abandonment is bots.
The prevention funnel
A second, narrower funnel tracks only the carts that saw a NavonaAI offer, from the moment it appeared to the revenue it generated.
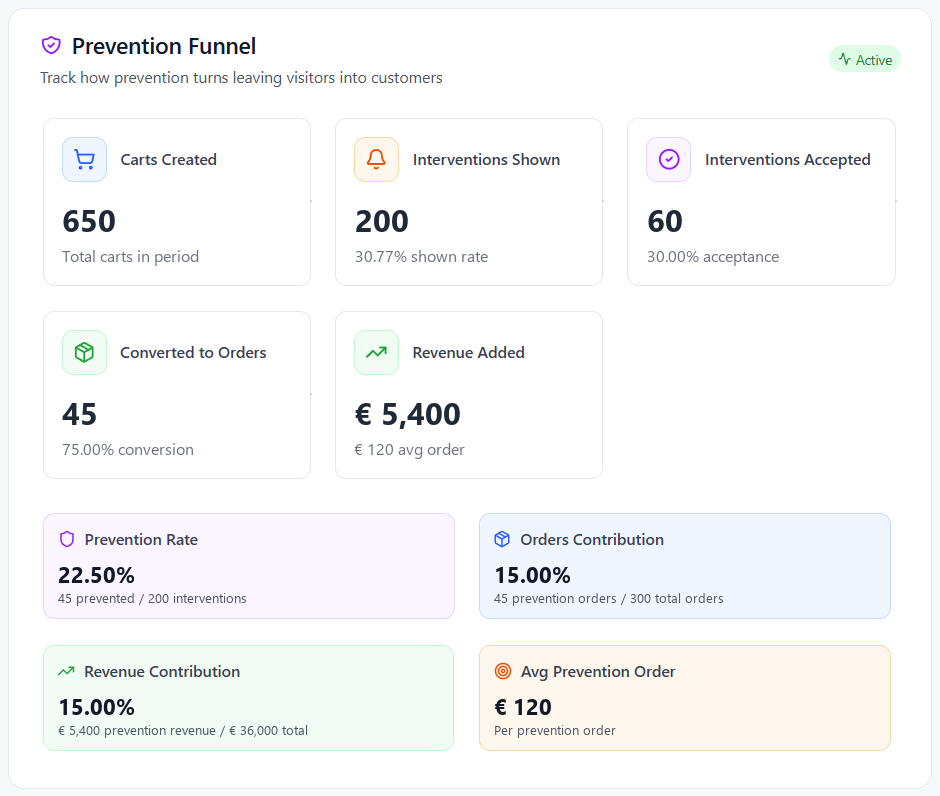
- Carts Created: Every cart created on your store during the selected period.
- Interventions Shown: How many of those carts saw a NavonaAI offer as the shopper was about to leave.
- Interventions Accepted: How many shoppers accepted the offer after it was shown.
- Converted to Orders: How many of those carts went on to become an order.
- Revenue Added: The total order value from carts that accepted the offer and converted.
What the funnel tells you
These summary metrics show the prevention funnel from different angles.
| Metric | How it's calculated |
|---|---|
| Prevention Rate | Carts converted ÷ interventions shown. It measures how many carts that saw an offer eventually became an order. |
| Added Revenue | The total sales value of orders where a NavonaAI intervention was accepted and converted. It includes taxes, shipping, and discounts, but doesn't account for returns or refunds. |
| Orders Contribution | Orders converted through prevention ÷ total orders in the period. |
| Revenue Contribution | Prevention revenue ÷ total revenue in the period. |
| Avg Prevention Order | Prevention revenue ÷ number of prevention orders. |
Prevention Rate vs. Interventions Accepted
These two metrics are easy to mix up because they happen at different points in the funnel.
For example:
- 200 carts saw an offer, so Interventions Shown is 200.
- 60 shoppers accepted the offer, so Interventions Accepted is 60.
- 45 carts became orders, so Converted to Orders is 45.
The Prevention Rate is 45 ÷ 200 = 22.5%.
So, accepting an offer and completing the order are two different steps. Prevention Rate is measured at the end of the funnel, not when the shopper accepts the offer.
The Most Abandoned Products table
The Most Abandoned Products table shows which products appear most often in abandoned carts. By default, it is sorted by Revenue at Risk, but you can also sort it by Abandonment Count, Abandonment Rate, or Conversion Rate.
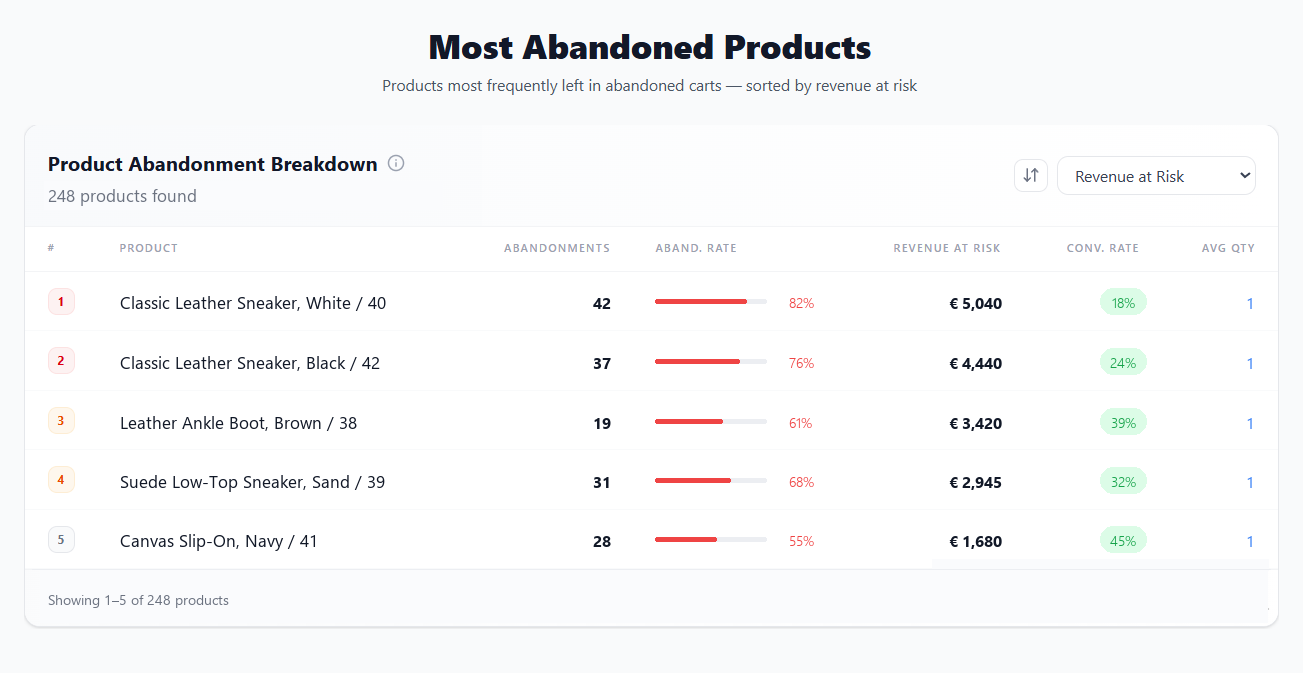
A single cart can contain several products, so the product count in this table will usually be higher than the total number of abandoned carts.
Where to go next
For the full definitions and edge cases behind every metric, see the analytics documentation.
For short definitions of the terms used across NavonaAI, see the glossary.